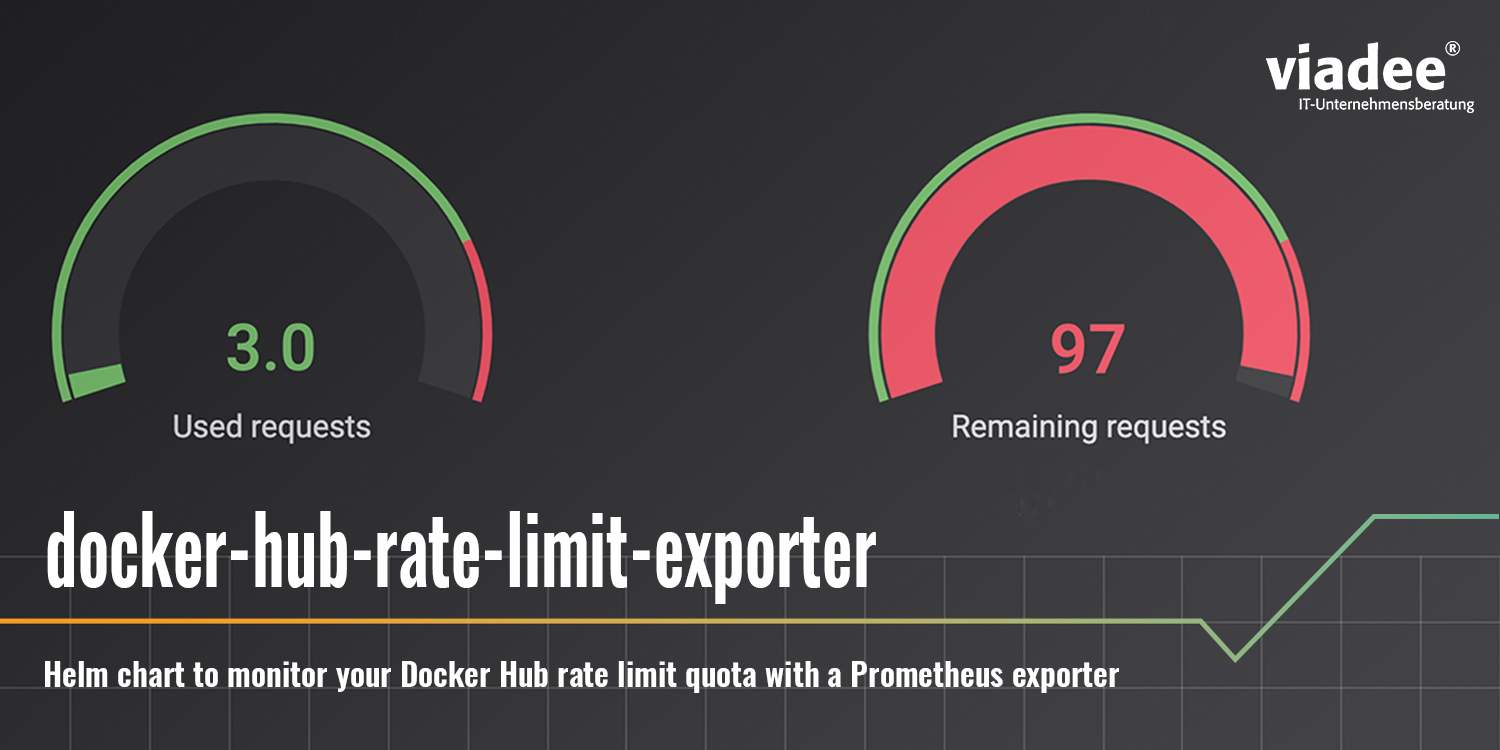
Looking for an easy way to install the docker-hub-rate-limit-exporter script into your Kubernetes cluster? We have the ultimate guide for you.
Recently, Docker introduced rate-limiting for the Docker Hub image registry. It restricts unauthenticated docker pull requests to 100 requests per 6-hour timeframe and authenticated requests from a free account to 200 requests per 6-hour timeframe (see here).
While there are plenty of ways to mitigate the impact of these limits on your development lifecycle and infrastructure, we still need a way to monitor the available requests for our infrastructure. Gitlab published a lightweight solution in their blogpost.
We took their work one step further and created a Docker image and Helm chart based on their script. Both allow you to easily install the docker-hub-rate-limit-exporter script into your Kubernetes cluster.
By the way, it’s Open Source and you can find all code on GitHub.
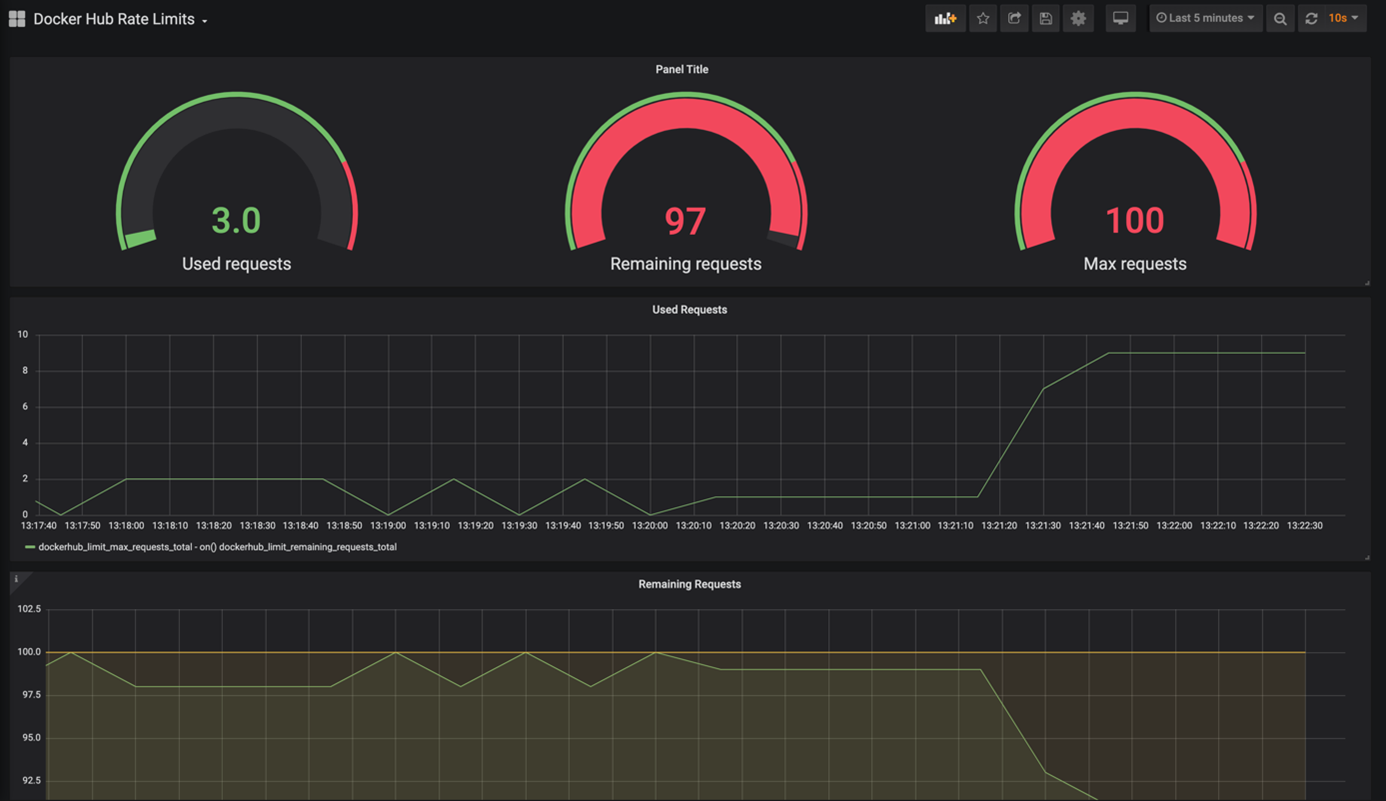
The helm chart supports the monitoring of unauthenticated requests and authenticated request to Docker Hub and offers an easy integration with the Prometheus Kubernetes operator. If you follow the guide described here, you will be rewarded with a Grafana-Dashboard that lets you monitor your remaining docker-hub pull requests as can be seen in the image above.
The Problem
If you exceed your Docker Hub rate limit quota, you will be greeted with one of the following errors messages the next time you attempt a docker pull request:
ERROR: toomanyrequests: Too Many Requests.
or
You have reached your pull rate limit. You may increase the limit by authenticating and upgrading: https://www.docker.com/increase-rate-limits.
To avoid getting caught by surprise by those error messages, we suggest using a monitoring solution as described below.
Prerequisites
This guide assumes that you have a running Kubernetes cluster with the Prometheus Operator and Grafana installed. Moreover, you need sufficient privileges to create Helm releases in your Kubernetes cluster.
Installing the Helm chart
To install the Helm chart into your cluster, you simply run the following commands:
$ git clone https://github.com/viadee/docker-hub-rate-limit-exporter.git
$ helm install docker-hub-rate-limit-exporter/chart --namespace=<desired namespace>
This creates a Helm release with the given name in the designated namespace. You can verify that everything works smoothly by port-forwarding the pod that was created:
$ kubectl port-forward 8080:80 -n <namespace>
Once the port-forward is configured, you can open your browser and navigate to http://localhost:8080. Here you will find a set of default metrics along with two metrics that correspond to your Docker Hub rate limit. These are:
- max_requests_total: The maximum number of requests you are allowed to do within the 6-hour timeframe.
- remaining_requests_total: The remaining requests based on your limit and the already sent requests. If this number reaches zero, you are rate-limited in the current timeframe.
Configuring the Prometheus Service Monitor
Next, we need to tell our Prometheus instance to scrap the metrics which are exposed by the deployment in the Helm chart. To do so, we can make use of the ServiceMonitor Custom resource that comes with the Kubernetes Prometheus operator. Since version 1.4 of this Helm Chart, the ServiceMonitor can be configured as part of the Chart. To activate it create the following value.yaml file:
Afterwards, install the Helm Chart with the value.yaml file to your cluster by running the following command:
$ helm upgrade docker-hub-rate-limit-exporter/chart -f values.yaml --namespace=<desired namespace> --install
If you are using the Helm Chart in a version below 1.4, you need to create the ServiceMonitor Custom Resource manually:
Save the above code snipped into a file called serviceMonitor.yaml and apply it to your Kubernetes cluster with the following command:
$ kubectl apply -f serviceMonitor.yaml -n <your namespace>
If you choose to install the ServiceMonitor into the same namespace as your Helm release, you can omit the namespaceSelector block in the manifest. If not, you additionally have to provide the namespace into which your Helm release was installed. Moreover, you may need to add further labels to your ServiceMonitor depending on your Prometheus configuration.
Configure Docker Hub Credentials
If you have a Docker Hub account and use it to pull images from the registry, you need to configure the Helm chart with those credentials, too. Otherwise, only the unauthenticated rate limit from your IP address will be monitored and not the limit of your Docker Hub account. You can configure the Helm chart to use your Docker credentials by providing additional parameters:
$ helm upgrade docker-hub-rate-limit-exporter/chart -f values.yaml --namespace=<desired namespace> --install \
–-set config.dockerhubUsername=<you dockerhub username> \
–-set config.dockerhubPassword=<Your dockerhub access token>
Alternatively, you can add the configuration to the values.yaml file from above (or create a new values.yaml file if you running a version below 1.4):
and install the Helm release into your cluster with the following command:
$ helm upgrade docker-hub-rate-limit-exporter/chart -f values.yaml --namespace=<desired namespace> --install
Creating the Grafana Dashboard
Lastly, we need to configure a Grafana Dashboard to visualize the remaining Docker Hub rate limit. Gitlab created a nice-looking dashboard for that purpose which can be used here. You can find the configuration of that dashboard here.
Simply copy the contents of the linked file and create a new Grafana dashboard. You can do so by following the following steps:
- Navigate to your Grafana instance.
- Click on Dashboards and then import.
- Paste the copied Dashboard json and click on Load.
Congratulations, you are ready to monitor your Docker Hub rate limit! Feel free to visit the GitHub repository and get involved. It’s Open Source and ready to help everyone out there.

🚀 UPDATE (Dec 09 '20):
The section about configuring the Prometheus Service Monitor was amended to reflect the new possibilities with release 1.4 of the docker-hub-rate-limit-exporter helm chart.
Back to blog overview